


September inflation stood at 14.63% according to the National Bureau of Statistics, whose report was released in October 2026. With November trading under way, shop owners and consumers need to understand why a slower national inflation rate does not necessarily mean every market price has fallen.
Featured image: Zmu'az4Z · CC BY 4.0 · Source
September inflation at 14.63%: what the number means
The National Bureau of Statistics reports an annual headline inflation rate of 14.63% for September 2026. Its Consumer Price Index catalogue lists the September report, dated 15 October 2026, and the official NBS website displays the rate. This is a measurement of price changes across an index, not a statement that every product costs 14.63% more.
A shopper in Epe and a wholesaler in Kaduna can experience very different changes in the goods they buy. The published national measure combines many items using a defined method and weight structure. Business owners should use it for context rather than substitute it for current quotations from their actual suppliers.

Why lower inflation does not mean cheaper goods
Inflation describes the rate at which prices change, not the absolute price on a shelf. A lower positive annual rate can mean prices are still higher than a year earlier, but rising at a slower pace. Prices of particular goods can fall, stay steady or rise faster than the average.
Illustrative example: If a fictional bag of goods cost ₦20,000 a year ago and now costs more, a slower annual rate does not automatically restore the old price. A shop owner explaining a price adjustment should use actual cost records, not imply that the September national figure determines the retail price of one item.
The new CPI base deserves attention
The NBS catalogue explains that the Consumer Price Index has been rebased, with 2024 as the reference year for prices and revised product coverage. Rebasing aims to keep the statistical basket aligned with evolving consumption. It matters when readers compare indices or old newspaper charts built on different reference periods.

The official CPI methodological description is worth reviewing before drawing a long historical comparison. A retailer does not need to become a statistician, but should understand that a headline figure reflects a defined basket rather than an invoice for each household.
What sellers should compare this month
Businesses preparing November orders should compare their real October and early November supplier quotations with past purchases. Use consistent units and product quality. A basket, bag or carton may not contain the same amount across suppliers. Record transport, storage, packaging and electricity separately from the purchase price.
Illustrative example: A vegetable trader in Offa keeps a dated list of what was paid for tomatoes, onions and transport. A supplier’s latest charge changes but the seller’s selling price may not move immediately because of existing stock or customer competition. The correct business decision depends on real inventory and demand, not the national index alone.
Food markets have additional moving parts
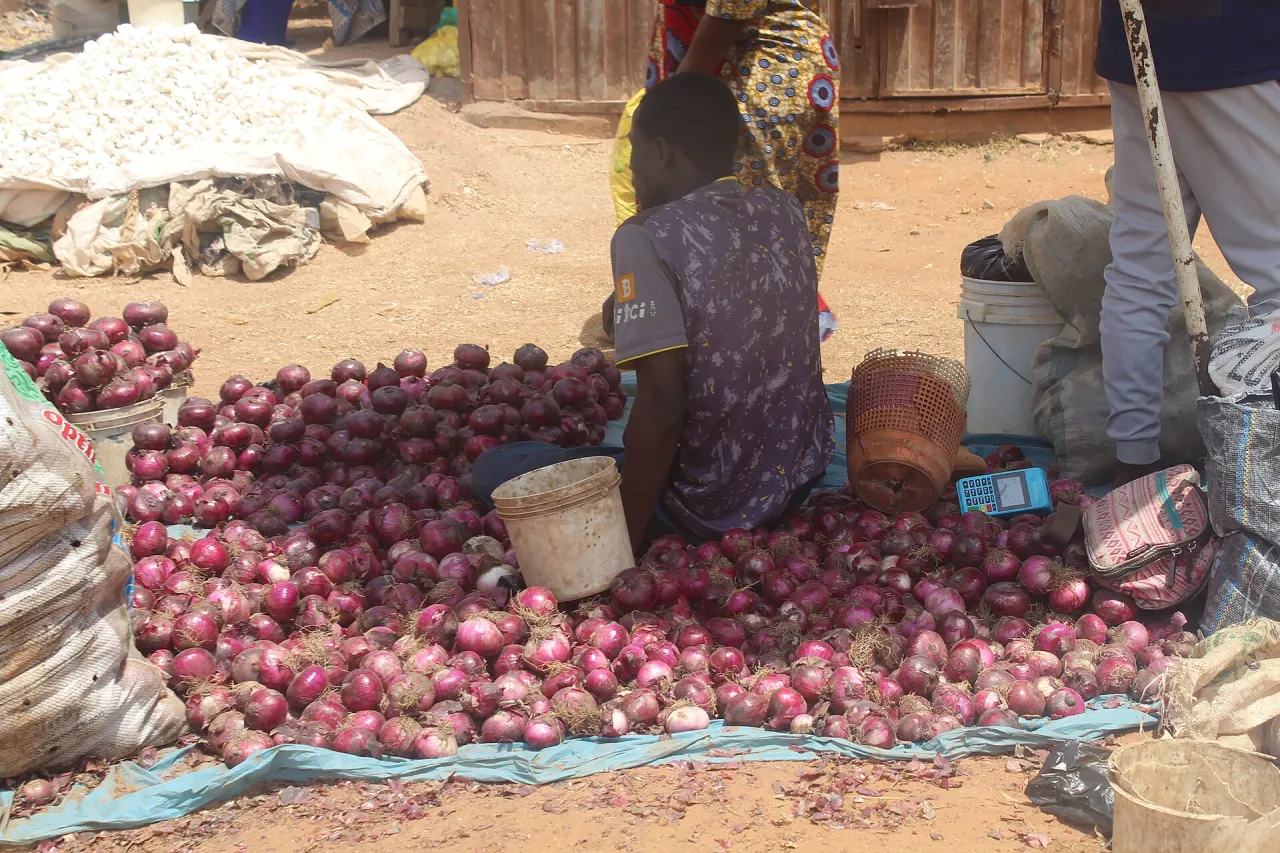
Agricultural products may be affected by harvest timing, spoilage, logistics, quality and storage. Even when a statistical average shows moderation, individual markets can face local supply disruptions. A company should not promise that seasonal produce will necessarily become cheaper without fresh local evidence.

The FAO Markets and Trade resource covers the broader role of agricultural markets, supply chains and trade. It is useful context for discussing why price movements are complex, although it does not supply a verified quote for a stall in Kaduna or Lagos on 5 November.
Cash flow can feel tight even when a headline improves
A retailer may still need more money to restock the same quantity of goods than in previous years. Customer incomes and purchasing habits can also change. Margin decisions should compare selling prices with actual landed costs, expected unsold inventory and the timing of payments.
Illustrative example: A fictional food distributor receives fewer bulk orders even though the published annual inflation rate has moderated. That is a hypothesis about a business, not a reported national trend. It demonstrates why managers must inspect their own transaction history before explaining changes in demand.
Use central-bank information without mixing indicators
The Central Bank’s official website also publishes monetary indicators and policy communications. Monetary policy rates, exchange rates and inflation figures are distinct concepts. They may interact in the wider economy, but one does not mechanically set a merchant’s next selling price.
When comparing economic statements, note the reporting month, year, source and exact measure. Do not confuse annual inflation with a one-month change or exchange-rate movement. A brief note on the origin of a figure can prevent a costly pricing assumption.
A practical November price-review routine
Select several important products, compare like-for-like acquisition costs over time, record current inventory and ask what customers are buying. If costs have changed, decide whether to adjust procurement, delivery terms, stock volume or pricing after reviewing the business’s full picture. Document which figures are measured and which are estimates.
G-Consulting’s rice mill resource and enterprise profile connect the subject to production and trade. The lesson from September inflation is not that every shop must cut or raise prices. It is that official statistics and local evidence should be used together, without confusing a national rate with one business’s costs.